
Measuring vertical jump using the center of mass displacement (COM) has become increasingly popular. This is mainly due to the convenience of set-up, a minimal footprint, and automated calculations. There are also arguments in the sports industry about which is a more accurate way to measure vertical jump – center of mass displacement vs. tough height minus reach. Performance testing comes down to consistency of how the drill is performed and how the results are collected. This study investigates the ability to measure vertical jump using a Dashr timing gate through parallel testing with force decks and a motion capture system.
We found that vertical jump calculated using flight time based on when the feet leave the ground reports a lower than actual vertical jump. This is because flight time measurement starts when the athlete’s foot leaves the mat/force plate and stops when they contact it again. This method underestimates the actual flight time of the athlete, as it does not consider plantar flexion of the ankle and vertical movement of the athlete’s COM before leaving the mat. Through parallel testing of a gold standard motion capture system, force plates, and the Dashr Laser Vertical system, an accurate and consistent correction can be applied to make all three systems accurate within acceptable tolerances. The Dashr Laser Vertical system differed from the gold standard motion capture system by 0.01in ± 1.55in. Proving that it is an acceptable low-cost solution for vertical jump measurement.
Introduction
The vertical jump is a valuable and well know athletic performance test that evaluates an athlete’s ability to generate power while also directly relating to in-sport movements. There are two main schools of thought when it comes to measuring vertical jump – touch height minus reach, and center of mass displacement. We feel that both are valid ways to quantify vertical jump, but there are some differences to being consistent in how you perform your evaluations is critical.
Touch Height Vertical
Touch height minus reach can be captured by using a vane-based system – like the Vertec. With this technique you need to measure the athlete’s reach (highest point they can touch while standing flat on the ground) and then have them perform a counter movement vertical jump and touch as high as possible. Max touch height (b) minus reach (a) now gives you their vertical jump height (Figure 1). Note that this method can also be used for “Max” (or approach) vertical jump, which is when the athlete takes 2 or 3 steps as an approach before jumping. This is a common test for volleyball and basketball players.
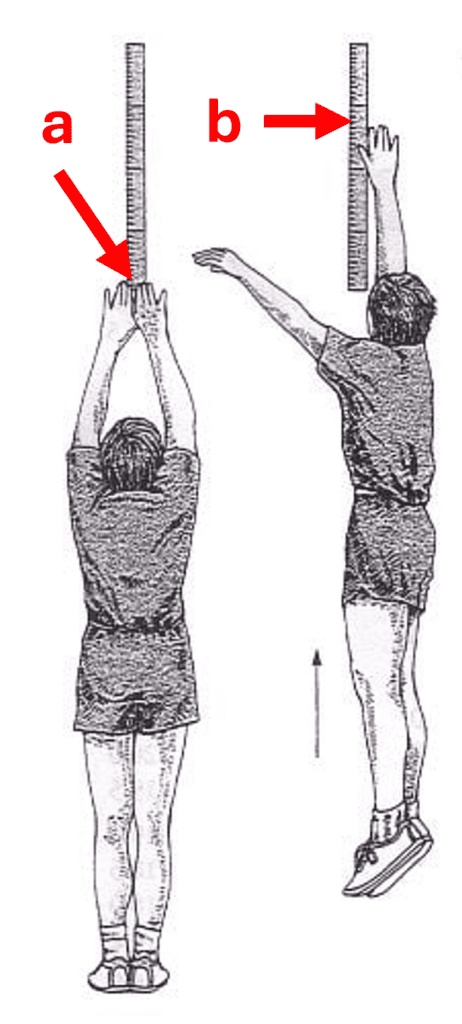
Figure 1 – Touch height minus reach = vertical jump
This is the most traditional way to perform the vertical jump, but there are ways to “cheat” the drill. Athletes may not fully extend their body when collecting their reach in order to make their vertical seam larger. There are also stretches/exercises that can be used to loosen up the shoulder/arm after collecting their reach that helps them then reach higher when performing the jump. There is also potential for body rotation for greater extension, dipping your left shoulder to extend your right (for example). Even with these things to look out for, as a coach/scout you will know the athlete’s max touch height, and that cannot be cheated.
Center of Mass Vertical
Another method for measuring the vertical jump is tracking the body’s center of mass (COM) through the jump. This vertical displacement is then reported as the vertical jump. The gold standard for this is a motion capture system that can visually track this movement and then report the displacement.
Technology such as jump mats and inertial measurement units (IMUs) can be used for this. These typically work by measuring how long the athlete is in the air and using projectile physics to convert that time to a vertical distance. With this test you do not need to measure the athlete’s reach or touch height, so it can be performed much faster and take up less space. It is much easier to travel with a jump mat than a Vertec if this is being used for a camp/combine or just moved across the gym. For this test. athletes are instructed to stand at a certain location and perform a counter movement vertical jump, landing with their legs straight to get a consistent measurement.
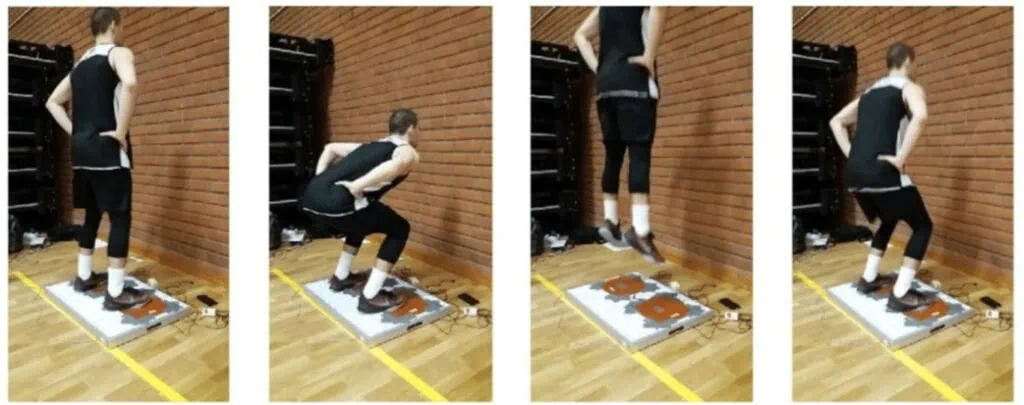
Figure 2 – Flight time measurement based on ground contacts.
This testing method can also be “cheated” if the athlete bends their knees before landing. This makes it appear as if the athlete was in the air longer. As a result, the system will potentially calculate a vertical jump higher than what was actually performed.
As you can see, there are pros and cons to both of these testing methods. What is most important is maintaining consistency in your testing – equipment, operation, and instruction.
Vertical Jump Testing options with Dashr
At Dashr we have embraced the more traditional touch height minus reach method by developing the Dashr Jump system which connects to a vane based jump station and allows you to electronically measure height, reach, touch height, and vertical. This is a great way to complete vertical jump testing quickly and accurately, but we understand that many situations require testing to be mobile – and it is not easy to travel with one or more vane based jump stations. As a result, we have developed a way to test the vertical jump using a Dashr timing gate.
For instructions on how to test the vertical jump using a Dashr timing gate (Dashr Laser Vertical), follow this link.
Methods
A 3rd party athletic performance laboratory tested the Dashr Laser Vertical (DLV) in parallel with a 12 camera Qualisys motion tracking system at 250 Hz using Visual3D by C-Motion (MoCap) and a set of Bertec force plates using Forcedecks at 1000 Hz for processing (force deck). A single marker was placed on the sacrum of the athlete to be tracked using MoCap to measure flight time and vertical displacement. Force decks were used to measure flight time for the jump as well as vertical jump distances based on both flight time and impulse momentum.
Seven college athletes (with experience testing their vertical) performing 3-5 jumps participated in the study, resulting in a total of 28 verticals for this initial validation evaluation. Standard statistics such as the Coefficient of Correlation and the Coefficient of Determination along with simple averages and standard deviations were used to compare the data sets.
The Dashr laser was set-up on top of the force decks so that DVL, force deck, and MoCap data could all be collected at the same time. Participants were instructed to step into the Dashr laser per the instructions above and perform a countermovement vertical jump with arm swing.
Results
Flight Time
Laying the laser flat on a hard surface results in the laser beam being about 0.5 in off the ground. This means that the flight time with the DLV flight time will be lower than the flight time based on ground contact. Using acceleration due to gravity and the flight time captured, we can approximate the amount of time needed to be added to the flight time.
Testing the DLV in parallel with the MoCap and force deck systems allows us to directly compare flight time measured by both systems (Figure 3). On average, the MoCap flight time was 80 ms ± 16 ms (0.08 sec ± 0.016 sec) longer than what was recorded by the force decks. The DLV differed from MoCap by 20 ms ± 32 ms (0.02 sec ± 0.032 sec).
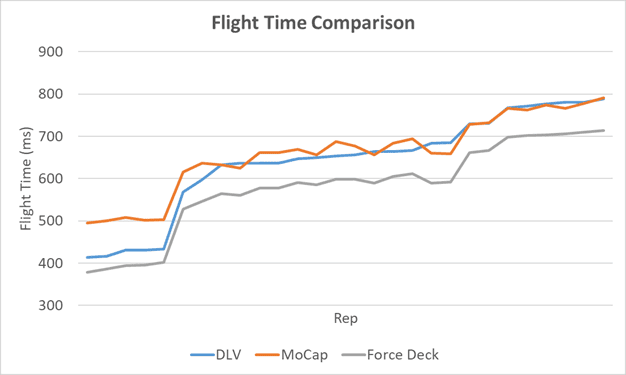
Figure 3 – Flight time measurements from each system.
There is a noticeable off-set in flight times between the MoCap and force deck systems, but the data sets correlate well when standard metrics were used for analysis. The Correlation Coefficient between flight time with the MoCap system and force decks was found to be 0.996, MoCap and DVL was 0.986, and force decks and DLV was found to be 0.995, all indicating very strong correlations. The Coefficient of Determination (R2) was 0.992 between MoCap and force decks, 0.972 between MoCap and DLV, and 0.991 for force decks and DLV, again – all indicating very strong correlations.
This tells us that the DLV method of measuring flight time is consistent with the established methods for measuring flight time, and now that we can consistently measure flight time we can accurately and consistently calculate the vertical jump.
Vertical Jump Validation
MoCap is the gold standard when it comes to movement analysis. When examining center of mass (COM) movement a full marker set can be used and then a COM can be calculated, but in this instance as we are performing a countermovement vertical jump, this can be accomplished by using a single marker placed on the athlete’s sacrum (Figure 4). This marker is tracked in 3-dimensons and is accurately reported to within a millimeter without the need for additional calculations and approximations that come with a full body marker set.
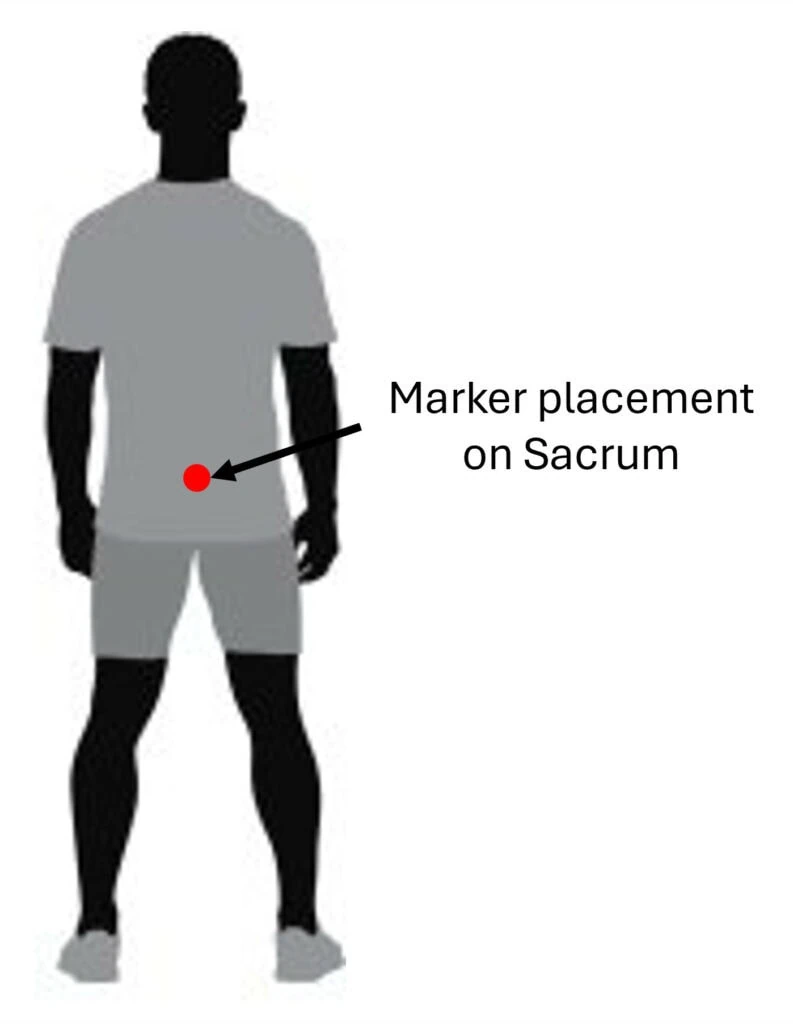
Figure 4 – Marker placement for MoCap system.
Similar to our flight time evaluation, there was a great correlation between all three systems will all coefficients greater than 0.9. Just like what we saw with the flight time evaluation, there was a noticeable off-set between the force deck vertical (using flight time calculation) and the MoCap system. The force decks differed from the MoCap system by 4.38 in ± 1.30 in and the DVL differed from the MoCap system by 0.01 in ± 1.55 in.
Discussion
The discrepancy between the MoCap and force deck systems was surprising. Even when looking at the vertical calculated by the force decks using impulse momentum differed from the MoCap system by 6.43 in ± 1.58 in.
When looking at the MoCap data, the vertical displacement from standing was captured by subtracting the participant’s standing COM position from the maximum vertical COM position. Figure 5 shows an example vertical displacement over time (blue line). You can see that the total flight time was 0.69 sec (694 ms), resulting in a 23.3 in vertical. This flight time is based off when the COM moved vertically from their standing position.
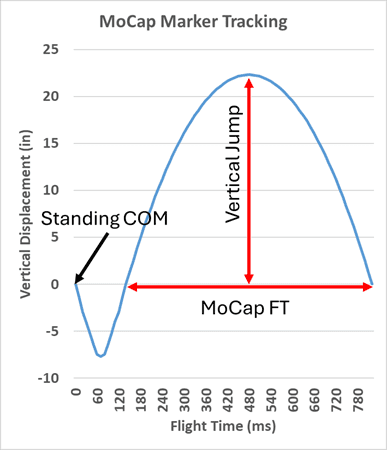
Figure 5 – Vertical marker position vs time – example
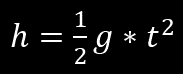
Using flight time with standard projectile physics (Equation 1) with the assumption that the body is “falling” creating an initial velocity of zero (Equation 2), removing the first portion of Equation 1.
EQ 1
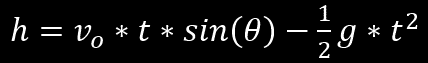
if vo = 0 and taking the negative out of gravity (downward acceleration) then:
EQ 2
For the same repetition presented in Figure 6, the force decks recorded a flight time of 0.61 sec (612 ms). Using Equation 2 you would take half of the recorded flight time (306 ms), since we are looking at the “falling” half of the jump, and the force decks calculate a vertical jump of 18.1in. This is 5.2 in lower than that measured by the gold standard MoCap system.
When we look at this example on the vertical displacement plot, we can see that the force deck starts recording flight time 0.082 sec (82 ms) after the participant’s COM moves. In Figure 5 you can see how that short of a time results in a more than 5 in difference in the vertical jump – which is quite significant.
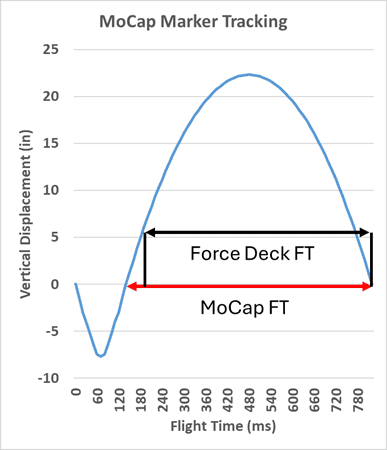
Figure 6 – Position tracking representation of flight time based on ground contacts vs. COM
Why is there such a difference in jump heights?
Most jump mats (and this force deck) calculate flight time based on when the foot leaves the ground, to when it lands again (ground contacts). This projectile physics approach is great for real world applications but in this case, it fails to consider the athlete’s COM already moving vertically due to ankle plantar flexion (Kozinc & Pleša) before leaving the ground (Figure 7 – see the COM height difference between 1 and 3). As a result, jump mats using this analysis will always underestimate the flight time when landing properly.
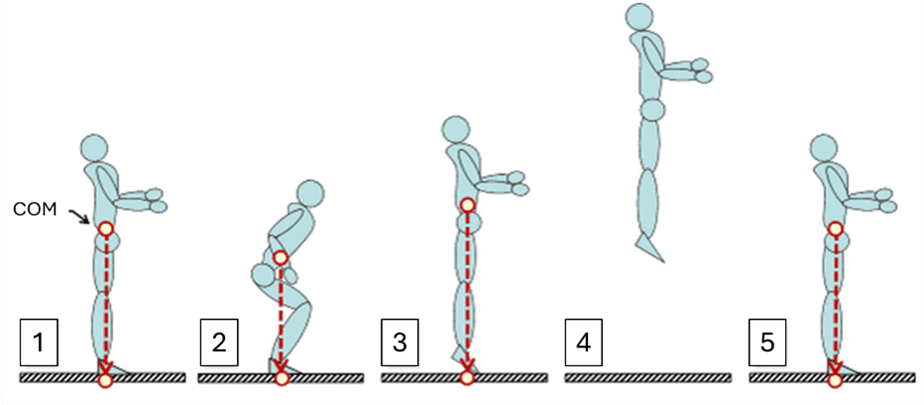
Figure 7 – Visual representation of COM height through the vertical jump.
Earlier we reported that on average MoCap had 0.08 sec (80 ms) longer flight times. Though we found the force decks to be inaccurate, the difference between the force decks and MoCap was quite consistent. We then experimented with adding 0.04 sec (half of 0.08 sec because we are looking at the falling half of the curve) onto the measured flight times from the force deck and using Equation 2 to calculate the vertical (see Equation 3). The result is presented in Figure 8 below.
EQ 3
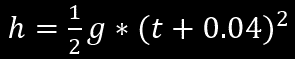
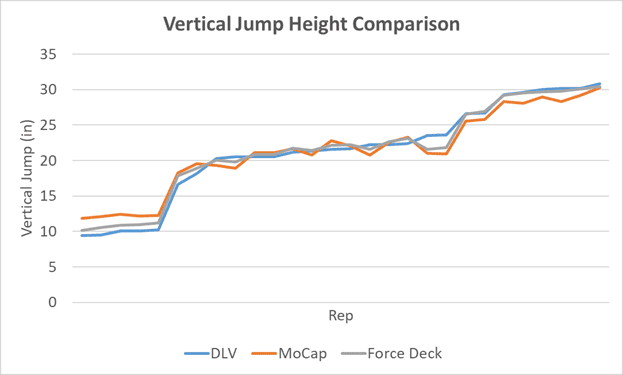
Figure 8 – Vertical Jump heights across each system.
Given that time is not linear in Equation 2 (t2) the addition of the 0.04 sec results in a small addition of height with shorter jumps, but a larger increase with longer/higher jumps. This is why a simple vertical distance constant off-set is not appropriate.
Now when we statistically compare vertical jump collection devices (after the time offset for the force deck) – the Correlation Coefficient between flight time with the MoCap system and force decks was found to be 0.996 where MoCap and DVL was 0.986 both indicating very strong correlations. Coefficient of Determination (R2) was 0.992 between MoCap and force decks, 0.972 between MoCap and DLV also indicating very strong correlations.
Once the time off-set was added, the data sets also showed acceptable accuracy when compared to the gold standard. The force decks differed from the MoCap system by 0.10in ± 0.93in (this was 4.38in ± 1.30in before the time off-set) and the DLV differed from the MoCap system by 0.01in ± 1.55in.
Conclusion
In conclusion, we found that vertical jump measurement systems that use the standard projectile physics equation between ground contacts underrepresent the vertical jump height due to measuring a lower than actual flight time. This is due to the exclusion of ankle planter flexion and vertical movement before leaving the ground. Through our research we found that difference to be 0.08 sec on average and when that additional time is added to the flight time collected by the force decks a more accurate vertical jump can be calculated.
This same concept was applied to the Dashr Laser Vertical to provide an accurate vertical jump measurement at a low cost, with minimal set-up, and requiring no technical experience. Therefore, when used properly, the DLV is a good solution for vertical jump testing.
Dashr users can now unlock this DLV feature within their account and use their existing Dashr lasers to measure vertical jump. This can replace the need to attach IMU sensors to each athlete or haul around a jump mat. Two Dashr lasers could be used for two vertical jump stations, then you could take those same lasers and set up a 40 yd dash – reducing the amount of equipment and software platforms required.
It is also worth noting that there are several studies that compare the Just Jump System to force plates for measuring the vertical and report that the Just Jump values are notably higher than those collected by the force plate. These studies assume the force plates are correct, but perhaps the Just Jump is considering the plantar flexion of the ankle and reporting a more accurate vertical jump than the force plates.
The time off-set used to correct the flight time can vary from athlete to athlete. Each athlete was consistent with their difference in flight time, the range of average differences observed across the participants was 66 ms to 110 ms. This variation is due to how quickly the athlete extends their ankle when leaving the ground.
Note that this was a preliminary study to explore the potential for a new vertical jump measurement solution. We recognize that the sample size here is small, and that a more extensive validation analysis would be appropriate. The data set used in this analysis is a subset of a larger study in process that will include additional participants to further fortify these findings. Once the complete study is published we will include a link to it on this page.
References
Kozinc, Ž., & Pleša, J. (2022). Discrepancy Among Different Methods for Vertical Jump Height Determination and Its Implications for Field-Based Testing: A Narrative Review. Measurement in Physical Education and Exercise Science, 27(3), 248–256.
Cheah, P. Y., et al. “Comparison of vertical jump height using the force platform and the vertec.” 3rd International Conference on Movement, Health and Exercise: Engineering Olympic Success: From Theory to Practice 3. Springer Singapore, 2017.
Eagles, Alexander, et al. “Motion capture system versus common force platform methodologies for vertical jump analysis.” International Journal of Physical Medicine & Rehabilitation 4.5 (2016).
Grainger, Madison, et al. “Comparison of two methods in the estimation of vertical jump height.” (2020).
Leard, John S., et al. “Validity of two alternative systems for measuring vertical jump height.” The Journal of Strength & Conditioning Research 21.4 (2007): 1296-1299.
McClelland, Emily L., Sunil K. Prajapati, and Peter Weyand. “Quantifying Getting High Under One’s Own Power–A Comparison of Vertical Jump Height Measurement Methods.” International Journal of Exercise Science: Conference Proceedings. Vol. 2. No. 14. 2022.
Nordin, Andrew. Comparing vertical jump height measurement methods. Diss. 2013.
McMahon, John J., Paul A. Jones, and Paul Comfort. “A correction equation for jump height measured using the just jump system.” International journal of sports physiology and performance 11.4 (2016): 555-557.
Dobbin, Nick, et al. “Validity of a jump mat for assessing countermovement jump performance in elite rugby players.” International journal of sports medicine 38.02 (2017): 99-104.
About the Author – Chase Pfeifer, PhD
Dr. Pfeifer is a former D1 athlete with bachelor’s and master’s degrees in mechanical engineering and a PhD in biomedical engineering. He spent 10 years at the University of Nebraska-Lincoln teaching in the Mechanical & Materials Engineering department while working on various projects at the Nebraska Athletic Performance Laboratory where he was the lead engineer for technology development.
Dr. Pfeifer also worked for Madonna Rehabilitation Hospitals for seven years where he started their Rehabilitation Engineering Center within their Institute for Rehabilitation Science and Engineering. Over that time Dr. Pfeifer developed countless assistive devices for individuals suffering from traumatic brain injuries, spinal cord injuries, strokes, and many other degenerative diseases. He was also heavily involved in technology development for motion tracking and analysis, taking part in many movement analysis projects and technology validation studies.
For a more comprehensive list of education, experience, publications, grants, and patents, please visit linkedin.com/in/chasepfeifer.